The Missing Bone in Root Cause Analysis
Why Your Fishbone Diagram Is Structurally Incomplete
INTELLIGENT MANUFACTURING TRANSFORMATIONTHE LEARNING LOOP
Manfred Maiers
3/24/20263 min read
Why Your Fishbone Diagram Is Structurally Incomplete
Walk into almost any manufacturing site and you will find it.
A whiteboard.
A problem statement.
A Fishbone diagram filled with familiar categories.
People.
Process.
Equipment.
Materials.
Environment.
The team is engaged. The structure is clear. The exercise feels rigorous.
And yet, the same problems come back.
Not because the team failed to analyze deeply enough.
But because the system itself is missing a critical dimension.
The Fishbone Diagram Works. Until It Doesn’t.
The Ishikawa diagram has earned its place in operational excellence.
It forces structured thinking.
It organizes complexity.
It prevents teams from jumping to conclusions.
In regulated MedTech environments, it is often embedded directly into CAPA processes and investigation workflows.
But there is a structural limitation that is rarely acknowledged.
Every cause must be forced into one of five predefined categories.
And when the real root cause does not fit, it gets misclassified.
That is where the breakdown begins.
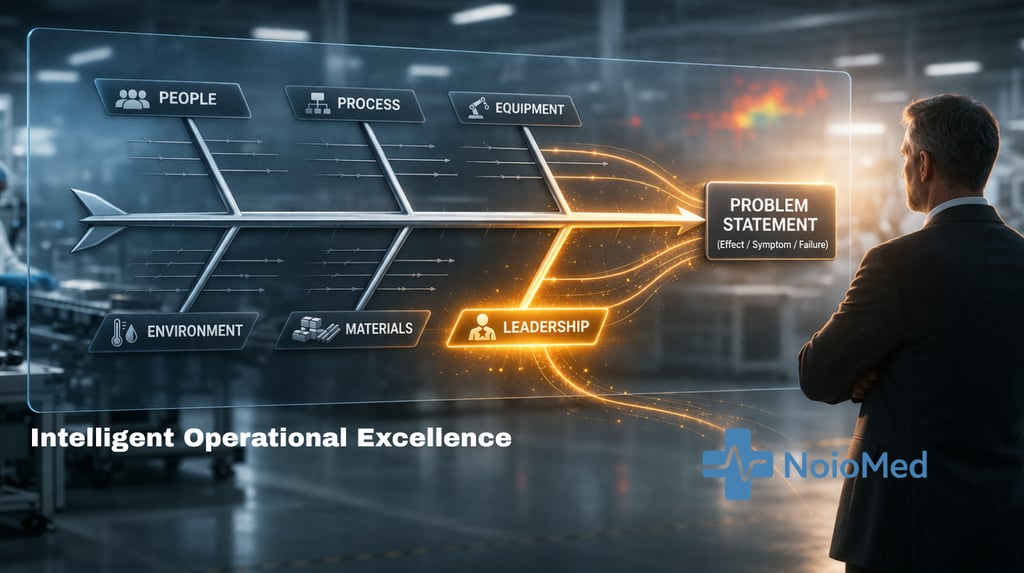
The Missing Bone: Leadership
There is a category that exists in every organization, influences every outcome, and yet is almost never explicitly represented in root cause analysis.
Leadership.
Not as a vague concept.
Not as a cultural buzzword.
But as a primary causal domain.
Leadership determines:
What gets prioritized.
What gets funded.
What gets measured.
What gets tolerated.
And most importantly:
What gets ignored.
When leadership is not explicitly modeled in root cause analysis, its influence does not disappear. It simply hides inside other categories.
The Misclassification Problem
Consider a common investigation outcome.
“Operator error.”
It gets placed under People.
Training is reviewed.
A retraining plan is executed.
The CAPA is closed.
Three months later, the issue returns.
Why?
Because the true root cause was never “people.”
It was:
Insufficient training time allocated due to production pressure.
A decision to prioritize output over capability development.
Lack of leadership visibility into training effectiveness metrics.
This is not a People problem.
This is a Leadership problem that was incorrectly categorized.
The Fishbone diagram did not fail.
It was incomplete.
How Leadership Manifests as Root Cause
In MedTech manufacturing, leadership-driven root causes are everywhere. They just rarely get named.
Example 1: CAPA Closure Without Effectiveness
A CAPA is closed on time. Documentation is complete. Audit passes.
Six months later, the same failure mode reappears.
Traditional classification:
Process weakness
Inadequate verification
Actual root cause:
Leadership emphasis on closure timelines over effectiveness validation
KPI structure that rewards speed instead of outcome durability
Example 2: Inspection Escapes Despite “Trained Operators”
Operators are certified. Work instructions are followed. Output targets are met.
Yet inspection escapes increase.
Traditional classification:
People issue
Process drift
Actual root cause:
Leadership decision to reduce inspection frequency to maintain throughput
Lack of investment in detection capability
No escalation triggered because KPIs focus on yield, not escape rate
Example 3: Supplier Quality Issues
Incoming defects increase. Supplier corrective actions are inconsistent.
Traditional classification:
Materials issue
Supplier performance variability
Actual root cause:
Strategic sourcing decisions driven by cost pressure
Inadequate supplier qualification resources
Leadership tolerance for risk in the supply chain
In each case, the Fishbone diagram captured symptoms.
But it missed the system-level driver.
Extending the Fishbone Diagram
To move from structured analysis to complete analysis, the model must evolve.
Leadership must become a primary branch.
Not an afterthought.
Not a sub-category.
A first-class causal dimension.
The Extended Fishbone Includes:
People
Process
Equipment
Materials
Environment
Leadership
And Leadership itself can be decomposed into:
Strategic decisions
Organizational structure
Incentive systems and KPIs
Resource allocation
Communication pathways
This shift does not complicate the tool.
It corrects it.
From Tool to System Thinking
Traditional root cause analysis is tool-centric.
Fill out the diagram.
Identify causes.
Assign actions.
But regulated MedTech systems require something more.
They require system thinking.
Because most failures are not isolated events.
They are the natural outcome of how the system is designed and led.
When Leadership is excluded, root cause analysis remains trapped at the operational layer.
When Leadership is included, the analysis reaches the system layer.
That is where real change happens.
Regulatory Reality: Leadership Is Already Expected
Even if the Fishbone diagram does not show it, regulators already do.
ISO 13485 places explicit responsibility on management for:
Resource provision
Quality system effectiveness
Continuous improvement
FDA’s QMSR reinforces alignment with these expectations.
CAPA requirements are not just about identifying causes.
They are about ensuring effectiveness.
And effectiveness cannot be achieved if leadership-driven root causes remain invisible.
Regulators may not ask for a Fishbone diagram with a Leadership branch.
But they will absolutely expect leadership accountability in the outcome.
The Strategic Shift
This is not about modifying a diagram.
It is about redefining how organizations think about problems.
If leadership is not analyzed, root cause analysis is incomplete.
If root cause analysis is incomplete, CAPA becomes a documentation exercise.
If CAPA becomes a documentation exercise, risk accumulates silently.
Intelligent Operational Excellence
Traditional Lean tools were designed for efficiency.
Today’s MedTech environment demands more.
It demands tools that integrate:
Operational performance
Risk management
Regulatory expectations
Leadership accountability
The evolution of the Fishbone diagram is one example of a broader shift.
From observation to insight.
From categorization to causation.
From tools to systems.
Closing Thought
The next time your team builds a Fishbone diagram, pause before you start filling in causes.
Ask a different question.
Not just:
“What went wrong?”
But:
“What decisions allowed this to happen?”
Because somewhere in that answer, you will find the missing bone.